Make flowcharts and workflow charts on your Mac
A flowchart shows how something works, one step at a time: what happens, what gets decided, and where it ends. SimpleDiagrams 5 is a Mac app for making them. Drop in the shapes, drag a line from one to the next, and the line finds its own way.
The flowchart symbols you need
These six cover nearly every flowchart. They all come with the app, in the Basic library or on the keyboard.
Start and end

Every flowchart starts and stops somewhere. Mark both with an oval: press O for an ellipse, or drag in the Circle.
Steps

One box for each thing that happens, starting with a verb, such as “Send the invoice”. Press R for a rectangle, or drag in the Square.
Decisions

A diamond asks a question, such as “Approved?”, with one line out for each answer. Use the Diamond.
Documents

When a step makes a report, a form or a letter, show it with the Document.
Stored data

The Cylinder stands for a database, or anywhere else information is kept.
Arrows
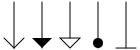
Arrows show what happens next. Press L for the Connector tool and drag from shape to shape, and the arrows stay attached when you move things around. To change an ending, select the line and click the button beside that end. There are plenty more endings than these five.
Make a flowchart in SimpleDiagrams
- Start at the top. Place an oval for the start, then a box for each step below it. Double-click a shape to type in it.
- Ask the questions. Wherever the work can go two ways, add a Diamond and write the question in it.
- Connect them. Choose Right-Angle Connector from the Connector tool, then drag from one shape to the next. The line turns square corners and works out its own route, and a new one when you move a shape. Double-click a line to label it Yes or No.
- Tidy up. Select a column of shapes and choose Arrange ▸ Align, then Arrange ▸ Distribute to space them evenly.
- Send it. Export a PNG, PDF or SVG, or print it. Or press Command-Shift-C to copy it as an image, ready to paste into a message, a document or a slide.
Workflow charts: who does what
A workflow chart is a flowchart that also shows who does each step. Draw a long rectangle for each person or team and type their name in it. Send it to the back with Arrange ▸ Send to Back, and lock it with Command-L so it stays put. Then put each step in its owner’s lane.
Right-angle connectors go around shapes in their way. If one takes the long way round a lane, right-click it and turn off Route Around Shapes.
More shapes for your charts
For a flowchart in a formal report, the Basic (Clean) library has the same kind of shapes with a tidier line. The Biz library adds people, roles and documents for business workflows, and UI Flow has phone screens, buttons and forms for mapping how someone moves through an app. All three come with SimpleDiagrams.
Download SimpleDiagrams 5 and try it free for 7 days
The free trial is in the download from this site. The Mac App Store edition is paid up front and has no trial.

The user guide has more on connectors and lining things up.
Mapping a whole process, with owners and timings? See how to draw a process map on a Mac.
Does your team draw workflows in BPMN notation? See BPMN diagrams on your Mac.
Making flowcharts in Visio or OmniGraffle now? See why SimpleDiagrams is a Visio for Mac alternative and an OmniGraffle alternative.